Diagrams that explain
Choose a diagram for a question. A flow chart explains a choice. A block diagram explains responsibility. A sequence explains ordering. A graph explains relationships. Use prose when it answers the question more directly.
A flow chart
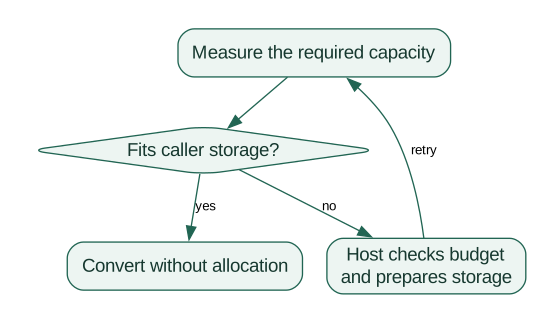
The drawing names the owner at the growth step. It does not suggest that the conversion core allocates. This distinction is part of the contract.
Make the result legible
Keep node labels short. Explain a longer rule below the drawing. Prefer one direction for the main path. Label a return edge with its condition. Use shape and text as well as color. A print reader may have no color at all.
Supply alternative text and a caption. Test narrow browser windows and the PDF page. If a diagram needs tiny type to fit, split it into two drawings. See Images, video, audio, and downloads for image and figure sizing.