Part VIII: Empirical Evaluation
We present Sibuna’s measurements, recorded by committed harnesses: primitive latencies, whole products under an external load generator with CPU and memory accounting, latency at equal offered load from an open-loop generator, and a comparison with Anubis, a widely deployed proof-of-work gate. A console run with eight live dashboards completes the record. Every number in this part comes from a committed result file, which each table names with its generation time, or from a design record. A functional pass and a performance measurement answer different questions, and a measurement on one host is not a ranking on another.
Methodology
The harnesses are commands of one Rust tool, tools/bench (the binary sibuna-bench), run through cargo xtask bench. A further tool records the console run.
| Harness | What it measures | Results file |
|---|---|---|
cargo xtask bench primitives |
Sixteen primitive workloads, plus two rows for the hashed rate limiter path, on one CPU: seven batches, median per operation with the min-max spread | primitives-latest.json, primitives-latest.md |
cargo xtask bench product |
Whole daemons under wrk: throughput, latency percentiles, CPU time per request and peak resident memory for Gate and Shield, in forward-auth and reverse-proxy modes |
product-latest.json, product-latest.md |
cargo xtask bench latency |
Latency percentiles of admitted requests at fixed offered rates, from an open-loop generator | latency-latest.json, latency-latest.md |
cargo xtask bench product --anubis |
The whole-product workloads with Anubis as a further product, behind caddy respond |
comparison-latest.json, comparison-latest.md |
cargo xtask bench admission --anubis |
Admission operations per second of Sibuna and Anubis in forward-auth mode, from two keep-alive clients | admission-latest.json, admission-latest.md |
sibuna-browser dashboards (tools/browser) |
A functional console run: eight live dashboards in headless Chromium while a generator sends traffic | console-8-dashboards-2026-10-15.md |
The .md files are summaries. The .json files hold every repetition, the machine, the revision, and the path, size and SHA-256 of every binary measured. Git keeps the history, so the directory keeps only the latest files. Some files were recorded by an earlier version of the harness and also hold rows of a second daemon build measured in the same run; this part reports Sibuna’s rows.
Primitives
Each workload runs in seven timed batches after an untimed warm-up of at most 1,000 operations. Mutable state (the spent set, the rate limiter) is rebuilt before each batch, outside the timer. Timers surround whole batches, never single operations: a clock read per operation would cost as much as the sub-100 ns work it measures. Per-operation percentiles are therefore not reported, and the spread is across batches. We report the median batch per operation, with the fastest and the slowest batch beside it.
The suite runs in a child process (sibuna-bench primitives-run) pinned to one CPU. On a shared host a busy SMT sibling or a lower clock slows a whole suite run, so the tool runs the suite three times (--rounds) and keeps, per row, the round with the lowest median. Within a round the statistics are as above.
Whole Products
For each mode (forward auth, reverse proxy) and each surface (Gate, Shield), the harness starts the daemon in memory with --algorithm hashcash --difficulty 8 --rate-limit 100000000 --idle-timeout 5 and four workers, one per CPU of its set. It obtains a session by solving the daemon’s Hashcash challenge with sibuna-pow, as a browser would. It then drives four workloads with wrk over keep-alive connections: 2 threads, 64 connections, 5 seconds, 3 repetitions.
admitted:GET /privatewith a valid session cookie. In reverse-proxy mode the request reaches the origin and its answer is relayed; in forward-auth mode the daemon answers200itself.challenged: the same request without a cookie, from a browser User-Agent. The daemon serves its challenge:200with HTML in reverse-proxy mode,401in forward-auth mode.allowed_static:GET /robots.txtfromcurl/8.0, which both surfaces admit without a challenge.attack: a valid session plusq=' OR 1=1--. Only Shield refuses it (403). Gate admits it, and in reverse-proxy mode relays it to the origin.
The origin is a stub (sibuna-bench origin): standard library only, one thread per connection, keep-alive, and a 41-byte page. CPU time per request is the daemon’s user plus system time from /proc/<pid>/stat over the run (10 ms ticks), divided by the requests wrk counted; the origin’s CPU is not included. Peak memory is VmHWM from /proc/<pid>/status, reset through /proc/<pid>/clear_refs before each run, so that each run reports its own peak. Every figure is the median of the repetitions, with the minimum and maximum kept beside it in the JSON file.
wrk is a closed-loop generator: it keeps 64 requests in flight. A faster daemon therefore receives more requests, and wrk’s percentiles leave out the requests it did not send while it waited for a slow answer (coordinated omission). Its p99 shows how the daemon behaves under its own saturation, not its latency at a given load. The latency harness answers that question.
Latency at Equal Load
The open-loop generator (sibuna-bench generate) runs one blocking thread per connection. Each of 64 connections sends GET /private with a session on a fixed schedule: request \(k\) of a connection is due at \(t_0 + o + kT\), where \(o\) is the connection’s offset and \(T\) its interval, independent of earlier answers. When an answer arrives after the next request was due, that request goes out at once and its latency counts from the time it was due, as in wrk2. When the connection was idle at the due time, latency counts from the actual send, so the generator’s own sleep overshoot is not charged to the daemon.
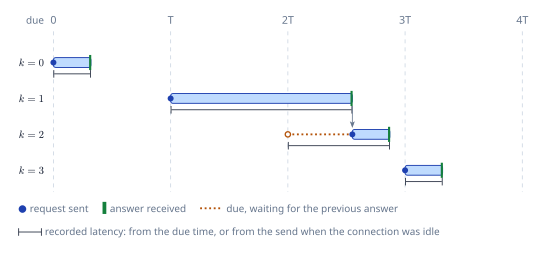
The harness runs the Shield surface and the admitted workload at five offered rates: 10,000, 25,000, 50,000, 100,000 and 150,000 requests per second, each with a 2-second warm-up, 10 measured seconds and 3 runs. The harness can measure two daemon builds in one run: it then starts both on the same CPU set and alternates between them at every rate and repetition, the idle one using no CPU, so that slow drift of the machine affects both alike. The recorded run did so. Percentiles are nearest-rank over every measured request of one run; each figure is the median of the three runs, with the min-max of p99 beside it.
CPU Sets
The CPU sets matter more than any other setting. The daemons run on CPUs 0 to 3 (--cpus; --workers is the size of that set). wrk, the latency generator and the origin run on CPUs 8 to 15 (--load-cpus). The primitive suite runs on CPU 4 (--cpu). Every process is pinned with taskset -c before it starts, so every thread it creates inherits the set. The admission harness uses two CPUs, 0 and 1, for the product, and CPUs 8 to 15 for its clients.
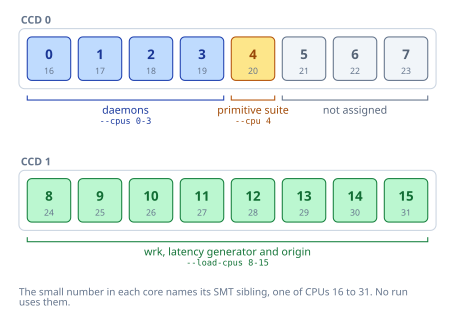
On other machines we choose sets that do not share cores (lscpu -e shows the topology).
Machine and Conditions
The files were recorded on paxos-zig: an AMD Ryzen 9 5950X 16-Core Processor (32 logical CPUs), Linux 7.0.0-28-generic x86_64, the powersave governor with boost enabled, rustc 1.99.0. The primitive, product and latency files were recorded on 15 October 2026, and the comparison with Anubis on 16 October 2026. The daemon is cargo build --release -p sibuna, the default build with SQLite storage and the console compiled in (SID 0010); the product and latency files name a binary of 49,113,856 bytes. Each file records its revision (efce14d for the primitives, 249d913 for the product and latency runs) with dirty: true; the working tree of the latter already held the reused connection threads that SID 0002 records, and SID 0002 cites latency-latest.md for their effect. The comparison and admission files name revision 54e4ec5 with dirty: true, because the working tree held the harness additions in tools/bench; their daemon is a release build of that revision (37,450,232 bytes). Their one-minute load averages were 3.53 before the comparison run and 0.56 when the admission run ended.
The files record one-minute load averages of 2.46 at the primitive run, 1.30 before and 52.31 after the latency run, and 52.31 before and 33.39 after the product run. The high figures are the latency generator’s 64 threads, which the product run followed directly.
How to Reproduce
We need Linux, taskset (util-linux) and wrk on PATH.
cargo xtask bench primitives
cargo xtask bench product
cargo xtask bench latency
cargo xtask bench help
cargo xtask bench first builds the daemon with cargo build --release -p sibuna, then runs sibuna-bench in release mode. The tool finds the daemon beside its own binary; --rust <path> overrides it. cargo xtask bench help lists the options, among them --cpus, --load-cpus, --cpu, --rounds, --repetitions, --seconds, --rates and --warmup. The section on Anubis below gives the commands that recorded that comparison.
Primitive Latencies
The table gives every row of the primitive run. The JSON file names each row by subsystem and workload (pow_verify and hashcash_16_bits, for example).
| Workload | ns/op | min-max |
|---|---|---|
| Hashcash verify (16 bits) | 70.2 | 69.9-71.0 |
| PoSW verify (depth 13, t = 16) | 22272.4 | 22257.0-22316.4 |
| Bot signatures (40, Aho-Corasick) | 55.7 | 55.3-57.2 |
| Bot signatures (40, sequential search) | 763.0 | 762.2-763.5 |
| IPv4 CIDR lookup | 32.0 | 31.8-32.2 |
| IPv6 CIDR lookup | 79.3 | 78.5-79.6 |
| Session token (keyed BLAKE3) | 155.8 | 155.3-156.4 |
| Session token (Ed25519) | 40587.5 | 40544.6-40631.1 |
| Spent set (Robin Hood), spend and look up | 21.0 | 20.8-21.3 |
| Rate limiter (GCRA), client bytes | 12.8 | 12.7-12.8 |
| Rate limiter, four rule scopes, client bytes | 13.1 | 13.0-13.2 |
| Rate limiter (GCRA), hashed client | 6.2 | 6.1-6.3 |
| Rate limiter, four rule scopes, hashed client | 6.3 | 6.2-6.4 |
| HTTP parse and cookie | 132.5 | 132.3-133.2 |
| Classification, Shield profile | 790.8 | 787.2-793.1 |
| Classification, Gate profile | 75.9 | 75.6-76.1 |
| WAF body scan (8 KiB) | 12784.3 | 12771.5-12809.2 |
| WAF body scan (8 KiB), SQL injection audited | 15485.4 | 15460.9-15530.1 |
The spreads are narrow: no batch of any row lies more than 2.8% from its row’s median. The figure shows the same rows on a logarithmic scale, which keeps rows of 6 ns and of 40 us readable side by side.
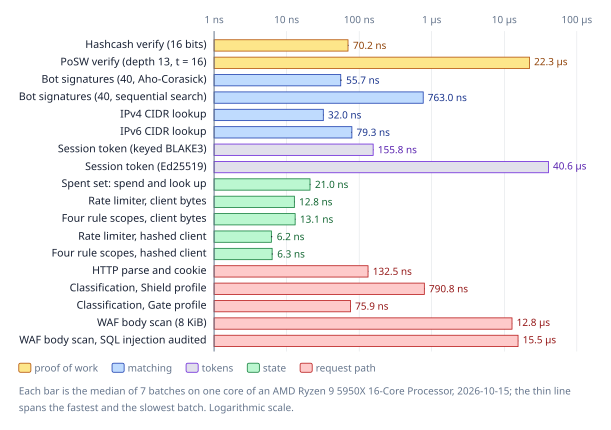
benchmarks/results/primitives-latest.json.¶Proof-of-Work Verification
Hashcash verification hashes a challenge, a separator and a decimal nonce: 70.2 ns. The sequential-work verifier checks graph openings: 22,272.4 ns. Its hash invocations and SHA-256 compression counts differ from Hashcash’s because the inputs differ in length. Both rows are bound by SHA-256, and sibuna-crypto uses the SHA-NI instructions when the CPU has them, detected at run time (SID 0010).
Matching
The dense Aho-Corasick automaton and sequential substring search use identical patterns and any-match semantics. The automaton is 13.7 times faster than the sequential search on the same 40 signatures (55.7 against 763.0 ns). Its tables use byte classes instead of 256 columns per state (SID 0006, Part F), which keeps the bot signature table at 42,244 bytes (the footprint table below). The CIDR classifiers take 32.0 ns (IPv4) and 79.3 ns (IPv6).
Tokens
The BLAKE3 MAC token verifies in 155.8 ns. sibuna-crypto implements BLAKE3 portably, without SIMD paths; those win on large inputs, but Sibuna hashes inputs under 100 bytes with BLAKE3, where the portable code is fast. Ed25519 compact tokens verify in 40,587.5 ns: the verifier uses width-5 and width-8 NAF digits and keeps the decoded public key. One Ed25519 verification costs about as much as 260 MAC verifications; the MAC is Sibuna’s default token scheme.
State
The spent-set row inserts a fresh tag and looks it up again: 21.0 ns. The table in this row has 16 shards of 4,096 slots (65,536 tags; the daemon’s default is 1,048,576), and it is emptied in place before each batch, outside the timer. Every batch therefore probes resident memory. An earlier version of the suite built a fresh zeroed table of the daemon’s default size for each batch; it timed the kernel mapping the table’s pages on first write, a cost a running daemon pays once, and it is not the row we report.
The rate limiter rows need care. The two rows for client bytes (gcra_check and gcra_four_rule_scopes) call the byte API: each check takes the client’s address as bytes and first computes a keyed SipHash-1-3 of it under a secret drawn from operating-system randomness. The secret key keeps anyone from computing addresses that share a victim’s probe window (SID 0010 and the sibuna-store documentation). These rows take 12.8 and 13.1 ns.
The daemon does not use the byte API on the request path. It hashes the client once per request (ClientHasher) and passes the hash to every table it consults. The two rows for a hashed client (gcra_check_hashed and gcra_four_rule_scopes_hashed) measure that path, with the hashes computed before the loop: 6.2 and 6.3 ns per check. The gap between the medians of the byte and hashed rows, 6.6 ns, is about the price of the keyed hash on these inputs, which the daemon pays once per request rather than once per table.
HTTP Parser
The parser row parses a 400-byte browser request and looks up a cookie: 132.5 ns. The crate’s own timing test agrees (crates/http: about 135 to 180 ns on the same machine). The parser is zero-copy; every field is a slice of the connection’s buffer.
Policy Engine
A full classification of a browser request takes 790.8 ns and the Gate profile 75.9 ns. The rows leave the request’s parsed client address empty, so the engine parses the client address text inside evaluation. The daemon parses the address once per request, before evaluation, so these rows include a small cost that the daemon pays outside the engine. The engine’s heap tables total 209,052 bytes (SID 0002).
WAF Inspection
The semantic scan of an 8 KiB body takes 12,784.3 ns, or \(12784.3 / 8192 \approx 1.56\) ns per byte. The second row scans the same body with the SQL injection category audited and the others enforced: 15,485.4 ns. When some category is audited rather than enforced, each field is inspected per category (SID 0004, “inspection modes”). The engine scans the field with the signature automaton once, for the set of categories whose signatures occur, then searches only the wanted categories among them, so auditing one category costs about a fifth more than enforcing all of them, not a scan per category.
Whole-Product Comparison
The tables give the medians of three five-second wrk runs for each surface and workload. The status beside each workload is the answer the harness expected and received.
Forward-Auth Mode
The ingress asks the daemon whether to admit a request; there is no origin and no body relay, so this is the purest measure of admission cost.
| Surface | Workload (status) | req/s | p50 | p90 | p99 | CPU us/req | Peak RSS KiB |
|---|---|---|---|---|---|---|---|
| Gate | admitted (200) |
211,345 | 151 | 175 | 305 | 11.84 | 15912 |
| Gate | challenged (401) |
198,315 | 160 | 180 | 326 | 13.15 | 16176 |
| Gate | allowed_static (200) |
211,053 | 152 | 175 | 305 | 11.73 | 16176 |
| Gate | attack (200) |
211,618 | 151 | 176 | 305 | 11.84 | 16176 |
| Shield | admitted (200) |
208,101 | 152 | 178 | 308 | 12.87 | 15928 |
| Shield | challenged (401) |
197,532 | 161 | 183 | 327 | 13.77 | 16192 |
| Shield | allowed_static (200) |
211,636 | 151 | 175 | 305 | 11.78 | 16192 |
| Shield | attack (403) |
210,549 | 152 | 175 | 307 | 12.32 | 16192 |
In forward-auth mode the daemon is not the bottleneck. Its cores busy (CPU time over wall time, cores_busy_median in the JSON file) stay between 2.47 and 2.72 of the four daemon CPUs, and every row lies between 197,532 and 211,636 requests per second. That points to the load generator as the ceiling. Near that ceiling a difference of a few percent between rows moves between runs: the Gate admitted row alone spans 205,151 to 211,513 requests per second over its three runs. The more useful figure in this mode is CPU time per request: 11.73 to 13.77 us, a little more for Shield than for Gate, and most for the challenged rows, which render the challenge answer.
Reverse-Proxy Mode
The daemon sits in front of the stub origin and relays admitted requests and responses. Proxied rows therefore include the origin’s own cost and one extra loopback hop.
| Surface | Workload (status) | req/s | p50 | p90 | p99 | CPU us/req | Peak RSS KiB |
|---|---|---|---|---|---|---|---|
| Gate | admitted (200) |
142,498 | 427 | 548 | 768 | 27.68 | 15896 |
| Gate | challenged (200) |
199,465 | 160 | 181 | 324 | 12.98 | 16160 |
| Gate | allowed_static (200) |
147,303 | 411 | 541 | 759 | 26.88 | 16324 |
| Gate | attack (200) |
143,900 | 422 | 555 | 745 | 27.67 | 16348 |
| Shield | admitted (200) |
138,965 | 438 | 571 | 857 | 28.57 | 16064 |
| Shield | challenged (200) |
195,188 | 162 | 185 | 328 | 13.73 | 16328 |
| Shield | allowed_static (200) |
145,673 | 415 | 551 | 746 | 27.27 | 16328 |
| Shield | attack (403) |
209,507 | 151 | 177 | 306 | 12.17 | 16328 |
Here the proxied rows (admitted, allowed_static, and Gate’s attack, which Gate relays) are CPU bound: cores busy is 3.96 to 3.98 of four. They serve 138,965 to 147,303 requests per second at 26.88 to 28.57 us of CPU per request, about twice the cost of an answer the daemon gives itself. The challenged rows and Shield’s attack row are answered by the daemon itself, and they look like forward-auth rows. Under saturation wrk’s p99 is the scheduler’s tail at the daemon’s own rate, so we read the tails of the next chapter instead.
In three reverse-proxy rows wrk counted responses outside the 2xx and 3xx classes where none was expected: 3 of 2,162,579 requests (Gate attack), 1 of 2,082,640 (Shield admitted) and 1 of 2,204,358 (Shield allowed_static), summed over the three runs. The files do not record which status these were. Reproducing the run with the daemon’s metrics showed 503 answers counted in sibuna_overloaded_total: wrk opens its 64 connections from one address, exactly the default --max-connections-per-ip, and when a connection was closed after its 4,096th request, wrk reconnected before the old connection had given its place back. The daemon now gives the place back before it writes the closing response (SID 0002, “bug fix”); the tables predate that fix.
Footprint
| Measure | Value |
|---|---|
| Daemon binary | 49,113,856 bytes |
| Idle resident memory, product runs | 5,592 to 5,788 KiB |
| Peak resident memory during a workload | 15,896 to 16,348 KiB |
| Resident memory after the workloads | 16,176 to 16,348 KiB |
| Idle resident memory, primitive run | 6,052 KiB |
| Policy engine tables | 209,052 bytes (heap) |
| Bot signature table | 42,244 bytes (heap) |
| WAF table | 164,908 bytes (heap) |
| Browser solver module (WebAssembly) | 14,744 bytes |
The ranges run over the four product runs (two modes, two surfaces), and for the peak over their sixteen workloads. The table sizes are heap sizes reported by the engine. The record does not break the binary’s size down.
Latency at Equal Offered Load
Both tables come from one run of cargo xtask bench latency. The errors column counts the generator’s connection, I/O and framing errors.
| Offered req/s | Achieved req/s | p50 | p90 | p99 (min-max) | p99.9 | max | Errors | CPU us/req |
|---|---|---|---|---|---|---|---|---|
| 10,000 | 10,000 | 30 | 32 | 37 (36-39) | 58 | 355 | 0 | 16.92 |
| 25,000 | 25,000 | 28 | 31 | 34 (32-34) | 45 | 1035 | 0 | 15.83 |
| 50,000 | 50,000 | 25 | 27 | 30 (30-30) | 40 | 3029 | 0 | 13.83 |
| 100,000 | 99,998 | 24 | 26 | 41 (40-42) | 62 | 2358 | 0 | 13.48 |
| 150,000 | 149,996 | 25 | 36 | 51 (51-52) | 74 | 1753 | 0 | 14.16 |
| Offered req/s | Achieved req/s | p50 | p90 | p99 (min-max) | p99.9 | max | Errors | CPU us/req |
|---|---|---|---|---|---|---|---|---|
| 10,000 | 10,000 | 56 | 61 | 65 (65-66) | 76 | 555 | 0 | 32.25 |
| 25,000 | 25,000 | 51 | 54 | 58 (58-60) | 72 | 1105 | 0 | 28.63 |
| 50,000 | 50,000 | 47 | 50 | 60 (58-66) | 74 | 3066 | 0 | 27.45 |
| 100,000 | 99,996 | 55 | 75 | 100 (100-104) | 150 | 2239 | 0 | 28.42 |
| 150,000 | 134,344 | 583934 | 1544160 | 1906273 (1631234-2218760) | 1967134 | 1989964 | 4 | 29.22 |
In forward-auth mode the p50 stays between 24 and 30 us at every rate. The p99 stays at or under 51 us up to 150,000 requests per second, and the p99.9 at or under 74 us. The daemon spends 13.48 to 16.92 us of CPU per request.
In reverse-proxy mode the p50 is 47 to 56 us up to 100,000 requests per second, the p99 100 us and the p99.9 150 us at 100,000. At 150,000 requests per second the daemon saturates: it completes 134,344 requests per second, and latency grows to seconds, as an open-loop test should show above capacity. That rate is close to the closed-loop proxied throughput of the previous chapter (138,965 requests per second for Shield admitted). The four errors of that row occurred in the overload.
The p99 spreads are narrow below saturation; the widest is the reverse-proxy p99 at 50,000 requests per second, 58 to 66 us. The max column is one request out of up to 1.5 million in a run. On a shared host we read it as the host’s worst moment, not as a property of the daemon.
What the Measurement Changed
External load has changed Sibuna’s design. The daemon serves each connection on a thread of its own (SID 0002, SID 0010), and its first latency runs found a tail that wrk had not shown. With 64 connections, each closed by the daemon after 4,096 requests, the 99.9th percentile at 100,000 admitted requests per second was 0.3 to 2 ms.
The diagnosis, recorded in SID 0002 and in the documentation of cmd/sibuna/src/tasks.rs, is thread turnover. Creating and ending a thread maps and unmaps its signal stack and returns its stack pages, and those address-space changes stalled the daemon’s other threads. One experiment settled it: a build that never closed connections, so that no thread was created during the run, gave 54 to 60 us at the same rate. The fix reuses connection threads: a thread that finishes its connection parks and takes the next one, so a steady stream of new connections creates no threads. A thread parked for 10 seconds ends and is joined by the next launch or the next thread to finish a task, so a burst does not leave its stacks resident. A thread whose connection panics ends instead of parking. At most --max-connections connections are served at once, as before.
The tables above are from the run after the fix: a p99.9 of 62 us in forward-auth mode and 150 us in reverse-proxy mode at 100,000 requests per second. The runs before the fix are not retained as result files, which is why their figures appear only in SID 0002 and in this section.
Sibuna and Anubis
Anubis, by Techaro, is a widely deployed proof-of-work gate that sits in front of web sites, much as Sibuna’s Gate does. We measured the official release binary of Anubis v1.27.0 (anubis-1.27.0-linux-amd64, 40,001,698 bytes) beside Sibuna on the same host, on the same CPUs, with the same workloads. The two result files were recorded with:
cargo xtask bench product --anubis <path/to/anubis>
cargo xtask bench admission --anubis <path/to/anubis>
Anubis started as the earlier Python drivers of this project started it: --bind, --metrics-bind, --target= (empty in forward-auth mode, the origin in reverse-proxy mode), --difficulty 2, --slog-level ERROR, --cookie-secure=false, and a policy that challenges every Mozilla User-Agent with DNSBL and the honeypot disabled. GOMAXPROCS equals Sibuna’s worker count, and every thread of either product is pinned to the same CPU set. Hashcash work is matched: 8 zero bits for Sibuna, 2 zero hexadecimal digits for Anubis, the same expected 256 hashes. The harness obtains each product’s session as a browser would. For Anubis it fetches the challenge page, reads the challenge from <script id="anubis_challenge">, finds the nonce whose SHA-256(randomData || nonce) starts with 00, and passes it to pass-challenge with the page’s verification cookie. In forward-auth mode the admitted and challenged workloads ask Anubis’s check endpoint (/.within.website/x/cmd/anubis/api/check).
Whole-Product Workloads
The four workloads, the load and the statistics are those of the whole-product harness, with one change: the origin is caddy respond, pinned to the load CPUs, as the earlier drivers used. Before every run the harness waits until fewer than 3,000 sockets remain in TIME_WAIT, because the Anubis reverse-proxy runs leave tens of thousands behind.
| Workload | Figure | Sibuna Gate | Sibuna Shield | Anubis 1.27.0 |
|---|---|---|---|---|
admitted |
req/s (status) | 210,682 (200) | 208,635 (200) | 36,509 (200) |
| p99 us | 305 | 308 | 7,477 | |
| CPU us/req | 12.09 | 13.21 | 106.30 | |
| Peak RSS KiB | 16,228 | 16,316 | 32,624 | |
challenged |
req/s (status) | 198,251 (401) | 193,087 (401) | 113,170 (401) |
| p99 us | 326 | 342 | 3,781 | |
| CPU us/req | 13.49 | 15.02 | 32.96 | |
| Peak RSS KiB | 16,240 | 16,328 | 32,696 | |
allowed_static |
req/s (status) | 212,569 (200) | 212,444 (200) | 89,904 (200) |
| p99 us | 304 | 304 | 4,547 | |
| CPU us/req | 11.73 | 11.95 | 41.63 | |
| Peak RSS KiB | 16,240 | 16,328 | 33,396 | |
attack |
req/s (status) | 212,086 (200) | 211,347 (403) | 36,853 (200) |
| p99 us | 305 | 306 | 7,283 | |
| CPU us/req | 12.07 | 12.56 | 104.88 | |
| Peak RSS KiB | 16,240 | 16,328 | 33,764 |
| Workload | Figure | Sibuna Gate | Sibuna Shield | Anubis 1.27.0 |
|---|---|---|---|---|
admitted |
req/s (status) | 106,376 (200) | 103,298 (200) | 19,398 (200) |
| p99 us | 3,331 | 3,321 | 11,062 | |
| CPU us/req | 27.02 | 27.92 | 190.40 | |
| Peak RSS KiB | 16,528 | 16,444 | 39,980 | |
challenged |
req/s (status) | 198,402 (200) | 197,327 (200) | 28,842 (200) |
| p99 us | 325 | 328 | 9,546 | |
| CPU us/req | 13.05 | 13.78 | 137.73 | |
| Peak RSS KiB | 16,544 | 16,464 | 516,872 | |
allowed_static |
req/s (status) | 105,427 (200) | 106,819 (200) | 28,862 (200) |
| p99 us | 3,320 | 3,316 | 30,124 | |
| CPU us/req | 26.24 | 26.52 | 135.41 | |
| Peak RSS KiB | 16,544 | 16,464 | 616,548 | |
attack |
req/s (status) | 105,616 (200) | 210,483 (403) | 23,399 (200) |
| p99 us | 3,327 | 306 | 14,124 | |
| CPU us/req | 26.98 | 12.28 | 169.04 | |
| Peak RSS KiB | 16,544 | 16,464 | 599,516 |
In forward-auth mode Sibuna served 193,087 to 212,569 requests per second with a p99 of 304 to 342 us, and Anubis 36,509 (admitted) to 113,170 (challenged) with a p99 of 3,781 to 7,477 us. Sibuna’s cores busy stayed between 2.49 and 2.90 of four, so the load generator set its limit; Anubis’s were 3.73 to 3.88, so Anubis was CPU bound. The clearest figure is CPU time per request: an admitted request cost Sibuna Gate 12.09 us and Anubis 106.30 us. A likely part of that difference is the session token. Anubis signs sessions with Ed25519 by default, and Sibuna checks a keyed BLAKE3 MAC (155.8 ns in the primitive table); the admission measurements below, where HS512 tokens raise Anubis’s session checks by more than half, support that reading.
In reverse-proxy mode Sibuna’s proxied rows served 103,298 to 106,819 requests per second at 2.77 to 2.98 cores busy. They are below the 138,965 to 147,303 of the stub origin in product-latest.json, and the daemon is not CPU bound, so the limit lies outside it: the origin, caddy respond, shares the load CPUs with wrk. Its tail shows in the p90 of 2.1 to 2.4 ms. Anubis served 19,398 to 28,862 requests per second at 3.68 to 3.97 cores busy and 135 to 190 us of CPU per request. Its resident memory rose from 39,980 KiB in the admitted workload to 516,872 KiB in challenged and 616,548 KiB in allowed_static, and it held 589,276 KiB after the workloads against 21,552 KiB at idle. The rise began in challenged, where every request receives a fresh challenge with its own id; this suggests a record kept per issued challenge, but the harness did not confirm the cause. Sibuna’s peak stayed between 16,228 and 16,544 KiB in every row of both modes.
Several rows are not like for like either:
- In forward-auth mode Anubis answers
/robots.txtand theattackpath itself with200, without an origin; Sibuna answers them as it answers any request in that mode. - Anubis has no request inspection, so it admits the SQL injection of the
attackworkload. Shield refuses it with403, after more work; Gate admits it, as Anubis does. - The products sign sessions differently (Ed25519 for Anubis by default, a keyed BLAKE3 MAC for Sibuna), and they render different challenge pages.
Admission Operations
The admission harness times the four operations that admission is made of, in forward-auth mode, with each product on two CPUs (two Sibuna workers, GOMAXPROCS=2). Two client threads on the load CPUs, each with one keep-alive connection, share each batch: 200 operations, or 64 proofs for verification, prepared before the batch. We report the median of seven batches.
- Session check: the check endpoint with a valid session (
200). - Unauthenticated check: the same without a cookie (
401). - Challenge bootstrap: what a browser fetches to start a challenge. For Sibuna that is two requests, the interstitial and the challenge record; for Anubis one, the page with the embedded challenge.
- Proof verification: one fresh proof per operation. Sibuna’s proof challenges are issued 25 ms apart, below the 50 per second at which its adaptive difficulty adds bits, so the matched work holds. Sibuna runs with
--challenge-rate-limit 100000000, so its limiter is checked but never exhausted.
Anubis ran twice, with its default Ed25519 tokens and with --hs512-secret.
| Product (token) | Session check | Unauthenticated check | Challenge bootstrap | Proof verification | RSS after, KiB |
|---|---|---|---|---|---|
| Sibuna (keyed BLAKE3) | 88,104 | 78,997 | 42,664 | 57,924 | 7,792 |
| Anubis 1.27.0 (Ed25519) | 10,951 | 28,619 | 7,893 | 12,668 | 33,400 |
| Anubis 1.27.0 (HS512) | 16,976 | 27,785 | 7,952 | 19,261 | 29,840 |
The ranges of the seven batches are in the file. Sibuna’s lie within 11% of its medians; Anubis’s are wider (its unauthenticated checks with Ed25519 tokens span 25,394 to 32,741), and a batch of 200 operations lasts only 2 to 25 ms, so we read these figures to about a tenth. The slower client’s time per operation gives the round trip: 22.7 us for a Sibuna session check, 182.5 us for an Anubis check with Ed25519 tokens and 117.7 us with HS512.
In none of the rows above did Anubis serve more requests, or use less CPU or memory, than Sibuna. That is a statement about these workloads on this host, and nothing more.
Console Overhead
SID 0007 sets the console’s isolation contract. Enabling the console may cost at most 1% of data-plane throughput and at most 10% of p99 latency, measured over a matrix of configurations (compiled out, compiled in but disabled, idle, and eight active dashboards) and workloads, with repeated interleaved runs and reported uncertainty. Inconclusive or noisy runs do not establish compliance, and primitive baselines and smoke runs cannot substitute for the gate.
SID 0010 records one measurement: with the console compiled in, disabled, storage only, or enabled and idle, the 16 product workloads stay within about 1% of the daemon built without it, which is within noise. The record names no result file for it. The configuration with eight active dashboards under load has not been measured, so the formal gate of SID 0007 remains open.
The eight-dashboard run checks function, not overhead. sibuna-browser dashboards started a release daemon on one SQLite node with its console, four workers and a policy that allows /static/*, /about, /missing/* and /broken/* and challenges everything else; an origin fixture answers /missing/* with 404 and /broken/* with 500. A generator sent 200 requests per second for 30 seconds, rotating ten paths (one an SQL injection), three User-Agents and 500 forwarded addresses. Each dashboard ran in its own Chromium with its own session: dashboards 1 to 3 as administrator sessions, dashboards 4 to 8 as wall displays opened with codes the first one minted, because the console allows five sign-ins per minute per address and per account.
| Measure | Value |
|---|---|
| Data-plane requests | 6,000 in 30.0 s (200 per second, 4 threads, one connection per request) |
| Answered | 6,000: 200 x 1,200, 401 x 3,000, 403 x 600, 404 x 600, 500 x 600 |
| Errors (no reply) | 0 |
| Latency p50 / p90 / p99 / max | 246 / 311 / 373 / 552 us (connect included) |
| Daemon VmRSS at start | 36,152 KiB |
| Daemon VmRSS with 8 dashboards open | 38,028 KiB |
| Daemon VmRSS after the traffic | 41,496 KiB (VmHWM 41,496 KiB) |
The tiles were read every two seconds during the traffic and 3 seconds after it. Every dashboard ended with the same totals (Requests 6,000, Admitted 2,400, Challenged 3,000, Policy denied 600, Origin 4xx 600, Origin 5xx 600), received 134 to 139 stats deltas, kept its WebSocket open, and reported no exception, console error or Content-Security-Policy violation. Eight browser subscribers are well under the console’s limit of 64. The daemon of this run has SQLite storage and the console, unlike the in-memory daemons of the product harness, so its resident memory is not comparable with theirs.
Not Measured
| Subject | Why it is not measured here | What stands in |
|---|---|---|
| SafeLine community edition 9.x | Ships only as a Docker Compose stack; the host had no Docker daemon, and the detector image is not an open-source build that can be compiled there | Published, vendor-reported facts (checked September 2026): detection rate 71.65% (balance) and 76.17% (strict), false positives 0.07% (balance) and 0.22% (strict); minimum host Linux x86_64 or arm64 with SSSE3, 1 CPU core, 1 GB RAM, 5 GB disk, Docker 20.10.14+ and Compose 2.0+ |
| Cloudflare WAF | A hosted service; a loopback measurement would measure the network path, not the WAF | Published plan quotas (checked September 2026): custom rules Free 5, Pro 20, Business 100, Enterprise 1000; rate limiting rules Free 1, Pro 2, Business 5, Enterprise 100 |
| A cluster under load | No harness drives several nodes on one PostgreSQL database yet | The protocol properties that SID 0011 specifies (one shared seed, issuer-bound challenges) and its three-node functional test (criterion 2); no measurement |
| Storage on the request path | Both daemons run in memory in every harness | SID 0011: one storage thread owns all SQL, and the request path never waits on it |
| TLS, WAN, real browsers | The harnesses use loopback and HTTP; sessions are solved once per case by sibuna-pow |
Nothing; a deployment measures its own path |
| The browser solver’s solve time | The harness solves at 8 bits with the native solver | The module size above; Part VII explains why native timings do not stand for browser solve times |
| Allocation counts | The harness does not instrument the allocator | The steady-state tests of Part V |
| Console isolation with eight active dashboards under load | The formal gate of SID 0007 has not been run | The SID 0010 figure (within about 1%, console idle) and the functional run above |
A row in this table is not a claim about the product’s performance. SafeLine’s own numbers concern detection quality, not throughput, and Cloudflare publishes plan quotas rather than per-request costs. Anyone with a Docker host can run SafeLine behind the same wrk workloads.