The Measure of the Tool#
The Measure of the Tool#
A converter’s claims are cheap until a corpus arrives. This chapter measures zenfmt against the tools a reader would actually reach for instead: pandoc, the universal document converter, firecrawl’s anydoc, the Rust converter whose format roster zenfmt set out to match, and Docling, the Python document-understanding toolkit, measured here in its model-free parser-only configuration. Everything below is generated. The tables, the bars, and the headline ratios come from benchmarks/results/latest.json, written by the same build step you can run tonight on your own machine.
Method#
Each tool converts each corpus file to GitHub-Flavored Markdown. The output is discarded. Each tool is invoked the way its documentation recommends. One warm-up run is discarded, and the tables keep the median of 5 measured runs. A tool runs only on formats its documentation claims. unsupported in the tables is itself a result. So is failed, which means an exit code other than zero on a format the tool claims.
Fairness is a design decision, not an accident:
- anydoc’s Node.js launcher and pandoc’s Haskell runtime startup are in the measurement, because they are in every real invocation. zenfmt’s own process startup is measured identically.
- zenfmt is built with
-Doptimize=ReleaseSafe. Bounds checks stay on. This is the mode the project ships. The competitors are their released binaries. - The corpus is nobody’s home turf. It holds real files from public sample repositories, Apache POI and LibreOffice test data, Project Gutenberg, and the W3C. It spans 16 files and every format family zenfmt reads.
Every file is real. Nothing in the corpus was authored for this benchmark.
| file | family | origin |
|---|---|---|
report.docx | DOCX | filesamples.com document sample |
memo.doc | Word 97 binary | filesamples.com, authored in Word 9.0 |
letter.odt | OpenDocument text | filesamples.com |
notes.rtf | RTF | filesamples.com |
sheet.xlsx | XLSX | filesamples.com |
table.xls | Excel 97 binary | filesamples.com |
grid.xlsb | Excel binary workbook | Apache POI test corpus |
sheet.ods | OpenDocument spreadsheet | filesamples.com |
slides.pptx | PPTX | Apache POI corpus, a real ApacheCon deck |
deck.ppt | PowerPoint 97 binary | Apache POI corpus, a 2.5 MB thesis defense |
slides.odp | OpenDocument presentation | the ApacheCon deck, converted by LibreOffice |
book.epub | EPUB | Project Gutenberg, Pride and Prejudice |
page.html | HTML | Project Gutenberg, the same novel as one page |
data.csv | CSV | FSU sample data, 25,000 rows |
article.pdf | pdfobject.com sample article | |
spec.pdf | W3C accessibility test file |
The headline#
speed ratio
anydoc wall time / zenfmt over 14 shared files
CPU ratio
anydoc user + system CPU time / zenfmt
peak memory ratio
anydoc peak resident memory / zenfmt
The three cards use AnyDoc because it shares the most successful corpus files with zenfmt. A ratio divides AnyDoc by zenfmt, so a value above one means AnyDoc used more of that measure in this run. The geometric mean is used because it treats proportional changes symmetrically. These values describe one corpus and one host; they are not quality scores.
| Comparison tool / zenfmt | Shared files | Speed | CPU use | Peak memory |
|---|---|---|---|---|
| Docling | 5 | 190.4x | 205.5x | 47.5x |
| anydoc | 14 | 6.9x | 7.9x | 10.1x |
| pandoc | 6 | 18.2x | 16.5x | 16.6x |
Support is a result#
Half of a converter’s value is answering at all. Rows are corpus files. A filled cell means the tool converted the file successfully.
| file | size | zenfmt | Docling | anydoc | pandoc | zenfmt wheel |
|---|---|---|---|---|---|---|
article.pdf | 18.4 KiB | ✓ | — | ✓ | — | ✓ |
book.epub | 545.5 KiB | ✓ | — | ✓ | ✓ | ✓ |
data.csv | 618.5 KiB | ✓ | ✓ | ✓ | ✓ | ✓ |
deck.ppt | 2519 KiB | ✓ | — | ✓ | — | ✓ |
grid.xlsb | 8.9 KiB | ✓ | — | failed | — | ✓ |
letter.odt | 4.2 KiB | ✓ | — | ✓ | ✓ | ✓ |
memo.doc | 32 KiB | ✓ | — | ✓ | — | ✓ |
notes.rtf | 32.4 KiB | ✓ | — | ✓ | ✓ | ✓ |
page.html | 832.6 KiB | ✓ | ✓ | — | ✓ | ✓ |
report.docx | 33.6 KiB | ✓ | ✓ | ✓ | ✓ | ✓ |
sheet.ods | 6.1 KiB | ✓ | — | ✓ | — | ✓ |
sheet.xlsx | 12.9 KiB | ✓ | ✓ | ✓ | — | ✓ |
slides.odp | 466 KiB | ✓ | — | ✓ | — | ✓ |
slides.pptx | 633.1 KiB | ✓ | ✓ | ✓ | — | ✓ |
spec.pdf | 13 KiB | ✓ | — | ✓ | — | ✓ |
table.xls | 13 KiB | ✓ | — | ✓ | — | ✓ |
Each column tells its own story. pandoc’s is honest minimalism: it never claimed the binary Office formats, the OpenDocument spreadsheet and presentation, or PDF input. Docling here is deliberately narrowed to its model-free parsers — Office Open XML, HTML, and CSV — so its blank cells are a benchmark choice, not a Docling limit; the next section explains why. anydoc’s one failed is the real-world XLSB workbook. Its sheet directory uses a 40-byte BrtBundleSh record where the specification’s example shows 36 bytes. Chapter 4 describes how zenfmt detects this variant by exact-consumption parsing.
Docling, parser only#
Docling is a document-understanding toolkit, not a plain converter: its strength is layout, OCR, and table models over PDFs and images. Those pipelines load machine-learning weights and are a different workload from the millisecond structural conversion this chapter measures. The benchmark therefore pins Docling to its model-free backends and denies every model download, so the row measures Docling’s own parsers converting Office Open XML, HTML, and CSV to Markdown — and nothing of its AI features. The cost it still carries is a real one: a fresh Python interpreter that imports the toolkit’s scientific stack before any document work begins, which is why its bars sit whole seconds above the compiled tools even on the files it does convert. The comparison is narrow on purpose; it keeps the workload appropriate for the modest machines zenfmt targets.
Latency#
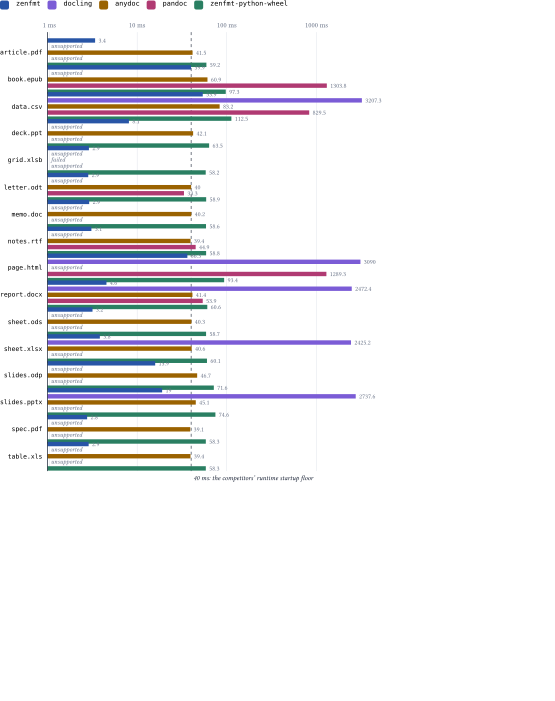
The numbers behind this chart
| File | zenfmt | docling | anydoc | pandoc | zenfmt-python-wheel |
|---|---|---|---|---|---|
| article.pdf | 3.4 ms | not supported | 41.53 ms | not supported | 59.22 ms |
| book.epub | 39.93 ms | not supported | 60.86 ms | 1303.76 ms | 97.33 ms |
| data.csv | 53.92 ms | 3207.25 ms | 83.18 ms | 829.45 ms | 112.47 ms |
| deck.ppt | 8.1 ms | not supported | 42.11 ms | not supported | 63.49 ms |
| grid.xlsb | 2.9 ms | not supported | failed | not supported | 58.18 ms |
| letter.odt | 2.85 ms | not supported | 40.02 ms | 33.29 ms | 58.86 ms |
| memo.doc | 2.92 ms | not supported | 40.18 ms | not supported | 58.62 ms |
| notes.rtf | 3.09 ms | not supported | 39.42 ms | 44.94 ms | 58.78 ms |
| page.html | 36.32 ms | 3089.96 ms | not supported | 1289.34 ms | 93.38 ms |
| report.docx | 4.55 ms | 2472.37 ms | 41.38 ms | 53.88 ms | 60.59 ms |
| sheet.ods | 3.18 ms | not supported | 40.29 ms | not supported | 58.71 ms |
| sheet.xlsx | 3.84 ms | 2425.2 ms | 40.58 ms | not supported | 60.09 ms |
| slides.odp | 15.9 ms | not supported | 46.7 ms | not supported | 71.64 ms |
| slides.pptx | 19 ms | 2737.56 ms | 45.08 ms | not supported | 74.61 ms |
| spec.pdf | 2.77 ms | not supported | 39.12 ms | not supported | 58.33 ms |
| table.xls | 2.88 ms | not supported | 39.35 ms | not supported | 58.33 ms |
The log axis is doing real work, because the tools live on different decades. Most zenfmt bars sit in the single digits to low tens of milliseconds; the 33 KiB DOCX converts in about four. That time is dominated by actual parsing, which is why the 2.5 MB deck.ppt costs no more than a small spreadsheet: the reader touches the text atoms it projects and skips the rest. The compiled competitors’ bars start near their runtime startup floor, about 40 ms for anydoc’s Node launcher and a similar amount for pandoc’s runtime, before any document work happens. Docling sits a whole decade higher still: even on the files it converts, a fresh interpreter imports its scientific stack before the first byte is read, so its floor is measured in seconds, not milliseconds.
zenfmt’s heaviest file is data.csv: 25,000 rows at about 54 milliseconds, its slowest by a small margin. The cost is deliberate — zenfmt measures every column across every row so it can emit width-aligned GFM table pipes, an O(rows × columns) pass that anydoc skips by emitting ragged ones — yet even here zenfmt finishes ahead of anydoc. On large structured inputs the ordering is not close: pandoc climbs to about 1.3 seconds on the EPUB book and the 850 KiB HTML page, where zenfmt stays well under a tenth of a second.
CPU use#
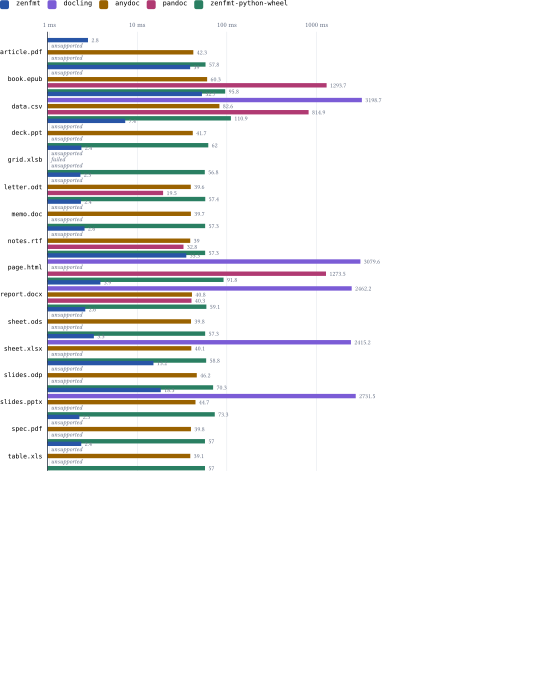
The numbers behind this chart
| File | zenfmt | docling | anydoc | pandoc | zenfmt-python-wheel |
|---|---|---|---|---|---|
| article.pdf | 2.83 ms | not supported | 42.27 ms | not supported | 57.81 ms |
| book.epub | 38.95 ms | not supported | 60.25 ms | 1293.69 ms | 95.79 ms |
| data.csv | 52.73 ms | 3198.73 ms | 82.59 ms | 814.92 ms | 110.89 ms |
| deck.ppt | 7.36 ms | not supported | 41.69 ms | not supported | 62.04 ms |
| grid.xlsb | 2.39 ms | not supported | failed | not supported | 56.75 ms |
| letter.odt | 2.33 ms | not supported | 39.6 ms | 19.46 ms | 57.4 ms |
| memo.doc | 2.36 ms | not supported | 39.72 ms | not supported | 57.25 ms |
| notes.rtf | 2.59 ms | not supported | 39.03 ms | 32.84 ms | 57.26 ms |
| page.html | 35.3 ms | 3079.59 ms | not supported | 1273.47 ms | 91.83 ms |
| report.docx | 3.89 ms | 2462.15 ms | 40.82 ms | 40.34 ms | 59.1 ms |
| sheet.ods | 2.64 ms | not supported | 39.84 ms | not supported | 57.27 ms |
| sheet.xlsx | 3.29 ms | 2415.16 ms | 40.14 ms | not supported | 58.76 ms |
| slides.odp | 15.19 ms | not supported | 46.2 ms | not supported | 70.26 ms |
| slides.pptx | 18.33 ms | 2731.49 ms | 44.69 ms | not supported | 73.3 ms |
| spec.pdf | 2.27 ms | not supported | 39.77 ms | not supported | 56.99 ms |
| table.xls | 2.38 ms | not supported | 39.1 ms | not supported | 57.04 ms |
CPU time measures processor work rather than what a person waits for. It includes user and operating-system time reported for the child process. On this single-conversion workload it follows wall latency closely, but it remains separate because a service pays CPU even when requests overlap. The ratio table above uses the same shared successful files as the speed comparison.
Memory#
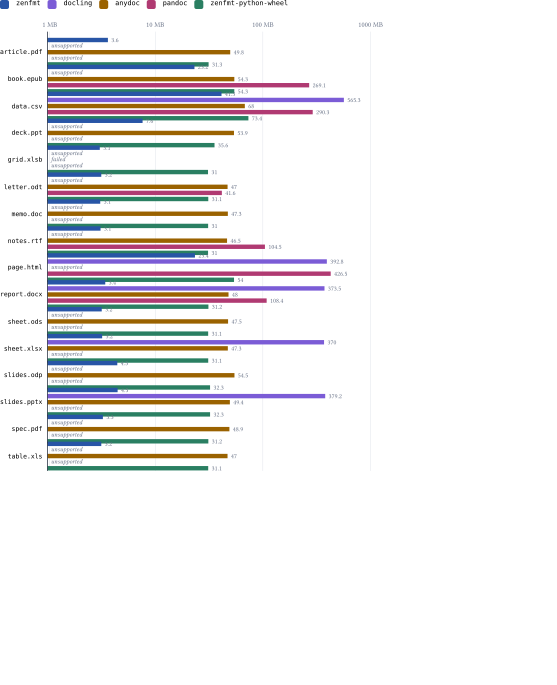
The numbers behind this chart
| File | zenfmt | docling | anydoc | pandoc | zenfmt-python-wheel |
|---|---|---|---|---|---|
| article.pdf | 3.64 MB | not supported | 49.75 MB | not supported | 31.34 MB |
| book.epub | 23.16 MB | not supported | 54.33 MB | 269.11 MB | 54.31 MB |
| data.csv | 41.3 MB | 565.31 MB | 68 MB | 290.31 MB | 73.41 MB |
| deck.ppt | 7.64 MB | not supported | 53.92 MB | not supported | 35.56 MB |
| grid.xlsb | 3.06 MB | not supported | failed | not supported | 30.95 MB |
| letter.odt | 3.16 MB | not supported | 47.02 MB | 41.61 MB | 31.13 MB |
| memo.doc | 3.09 MB | not supported | 47.3 MB | not supported | 31.03 MB |
| notes.rtf | 3.11 MB | not supported | 46.5 MB | 104.52 MB | 30.98 MB |
| page.html | 23.41 MB | 392.77 MB | not supported | 426.53 MB | 53.98 MB |
| report.docx | 3.44 MB | 373.45 MB | 47.98 MB | 108.44 MB | 31.22 MB |
| sheet.ods | 3.19 MB | not supported | 47.53 MB | not supported | 31.05 MB |
| sheet.xlsx | 3.22 MB | 370.03 MB | 47.28 MB | not supported | 31.09 MB |
| slides.odp | 4.45 MB | not supported | 54.48 MB | not supported | 32.33 MB |
| slides.pptx | 4.48 MB | 379.19 MB | 49.38 MB | not supported | 32.34 MB |
| spec.pdf | 3.27 MB | not supported | 48.91 MB | not supported | 31.17 MB |
| table.xls | 3.16 MB | not supported | 46.98 MB | not supported | 31.08 MB |
Memory tells the architecture story more plainly than latency does. zenfmt’s peak sits a small constant above the input size. There is one arena per conversion, flat struct-of-arrays storage, and no DOM. pandoc builds a full tree in a garbage-collected heap: over 100 MB for a 33 KiB DOCX, and more than 400 MB for the HTML page. anydoc pays a flat 48 MB before documents enter the picture. On the shared files the geometric-mean gap is an order of magnitude. It widens exactly on the inputs where memory matters.
The shape of the win#
One more picture makes the distribution visible. Take each file both zenfmt and anydoc convert. Divide anydoc’s median wall time by zenfmt’s. Sort. The result is not one lucky file carrying an average. All 14 shared files land on the winning side of parity; data.csv is the closest at 1.5x. The spread tells you the rest: small files are dominated by the competitor’s startup, and large files are dominated by parsing.
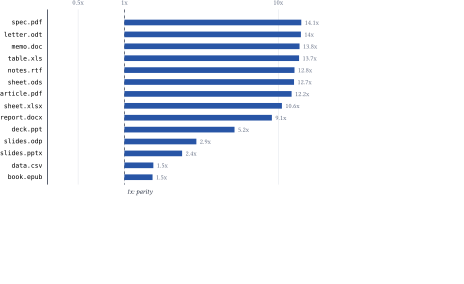
The numbers behind this chart
| File | Speedup over anydoc |
|---|---|
| article.pdf | 12.21x |
| book.epub | 1.52x |
| data.csv | 1.54x |
| deck.ppt | 5.2x |
| letter.odt | 14.04x |
| memo.doc | 13.76x |
| notes.rtf | 12.76x |
| report.docx | 9.09x |
| sheet.ods | 12.67x |
| sheet.xlsx | 10.57x |
| slides.odp | 2.94x |
| slides.pptx | 2.37x |
| spec.pdf | 14.12x |
| table.xls | 13.66x |
Where the time goes#
The process benchmark treats each tool as a black box. A second harness, zig build benchmark-stages, opens zenfmt’s box from inside the library: for each corpus file it times a conversion through a probe writer that emits nothing, which prices reading, tree building, validation, and the manifest. A timed wrapper then measures the ordinary Markdown writer callback directly. The residual after subtracting both from total is the lowering share; it also includes the small writer setup and finalization difference. That residual is derived, not directly measured, and the results file says so in a derived field. For a focused profile, append -- --file data.csv --iterations 25; the default remains five runs over the full corpus.
| File | Read (ms) | Lower (ms) | Write (ms) | Total (ms) |
|---|---|---|---|---|
book.epub | 18.31 | 2.8 | 5.71 | 26.82 |
data.csv | 11.05 | 7.28 | 10.98 | 29.31 |
deck.ppt | 3.81 | 0.04 | 0.16 | 4.01 |
page.html | 12.87 | 2.95 | 5.91 | 21.72 |
report.docx | 0.47 | 0.02 | 0.03 | 0.52 |
sheet.xlsx | 0.36 | 0.02 | 0.02 | 0.4 |
slides.odp | 5.9 | 0.08 | 0.11 | 6.08 |
slides.pptx | 4.93 | 0.2 | 0.11 | 5.25 |
Two facts fall out. Parsing dominates the container formats: an ODT or a PPTX spends almost all its time inside the archive and XML, and the Markdown writer is nearly free. The 633 KiB CSV now spends 10.4 ms reading, 6.6 ms in the lowering residual, and 9.9 ms in the writer. Stage separation found the 0.3.0 regression: validation and lowering each created hard-cap-sized scratch storage repeatedly as they visited a wide document. The current implementation allocates one scratch area for each validation or lowering plan and reuses it synchronously. That keeps the same bounds and decisions while avoiding work proportional to the node count times the hard cap.
The Python wheel#
The same engine ships to Python as the zenfmt wheel (ZDS 0014), and the benchmark measures what users actually install: zig build builds the wheel, installs it into a clean isolated environment, verifies artifact parity against the same-revision CLI, and only then times it. The detailed results land in
benchmark-pythonbenchmarks/results/python.json; the process harness adds a cold zenfmt-python-wheel row beside the CLI. Cold and warm numbers answer different questions and are never merged into one headline.
cold import
fresh interpreter,
import zenfmtcold first conversion
import, load, verify, convert
warm memory call
median corpus file, in-process
boundary microbenchmark
tiny text; FFI + copies + models
The boundary microbenchmark is reported separately and never used to claim corpus throughput: it exists so native loading, validation, copying, and model construction stay visible when parsing work is negligible. Parity ran before timing: 16 corpus files compared for format ids, artifact digests, resource digests, and report codes — all agreed.
| Threads | Documents | Wall (ms) | Docs / s |
|---|---|---|---|
| 1 | 80 | 855.7 | 93.49 |
| 2 | 80 | 441.66 | 181.14 |
| 4 | 80 | 237.71 | 336.54 |
| 8 | 80 | 173.7 | 460.56 |
Converter shared across worker threads over independent corpus documents. The GIL is released for every native call, so throughput scales with cores until conversion saturates memory bandwidth.Head to head on the shared corpus, the wheel’s cold child-process row — a fresh interpreter per document, directly comparable to the CLI row — runs at 9.9x the CLI’s wall time (geometric mean over 16 files; above 1.0 means the CLI is faster). The difference is interpreter start plus one-time bridge verification; the warm rows above are what a long-running service pays.
The server lens: against Apache Tika#
The rows above measure a converter that starts, converts one file, and exits. A different question is how the long-running service compares, and the natural comparison there is Apache Tika, the tool teams reach for when they want extraction behind a port. zig build benchmark-server starts zenfmt in open mode and a pinned Apache Tika Server (4.0.0-beta-1, its documented Markdown handler) on loopback, and writes benchmarks/results/server.json. These numbers are never merged with the native rows above: process startup, HTTP transfer, and service isolation are different costs.
startup ratio
zenfmt is ready in 0.11 s; Tika’s JVM and parser pool take 7 s; the ratio is Tika divided by zenfmt
sampled resident ratio
53 MB resident against Tika’s 1815 MB parent and direct parser children
shared warm ratio
geometric mean over the 16 files both services convert, each service warmed to steady state first; the ratio is Tika divided by zenfmt
Warm latency here measures steady state: both services convert one discarded warm-up per file before the timed samples, because Tika’s per-client parser mode pays several seconds per forked worker on its first requests. zenfmt had lower median latency on all 16 shared files in this run. The closest was data.csv, where Tika used 2.3x the wall time. This is one host and corpus, not a claim about every service workload. Concurrent throughput, in documents per second, scaled with cores for zenfmt in this short run:
| concurrency | zenfmt | Tika |
|---|---|---|
| 1 | 553 /s | 4 /s |
| 2 | 1075 /s | 8 /s |
| 4 | 2016 /s | 14 /s |
| 8 | 2655 /s | 15 /s |
One caveat belongs to Tika, not against it. Tika 4 parses in forked child processes, so a parser that panics or exhausts memory takes down a worker, not the service. zenfmt converts in-process; the deployment guide requires a supervisor and operating-system limits for exactly this reason. The speed and memory numbers are real, and so is that difference; the record keeps both visible rather than collapsing them into a single verdict.
Reading it honestly#
These measurements need their caveats stated plainly.
- Startup is part of the story, but not all of it. Subtract the 40 ms runtime floor from every anydoc bar, and its document work is competitive on small files. zenfmt’s advantage there is the sum of native start and arena parsing. It is not evidence that the Rust code is slow. On the large inputs the gap survives the subtraction.
- Completeness is bounded by the corpus. Sixteen real files cover every reader once. They do not cover every construct. The per-format fidelity claims rest on the test suites and the ZDS mapping tables, not on this chapter.
- PDF numbers measure text extraction, structure heuristics included. They do not measure OCR. Scanned documents are refused with
pdf.no-textrather than converted into silence. - One machine, one printing. The shapes replicate across machines. The absolute values are yours to re-measure with one build command.
Exercise 9.1.
Add another corpus file: a Markdown document of at least a megabyte. Predict all three of zenfmt’s bars before running. Which tool’s ordering changes? pandoc is a Markdown-native tool. Why does it not obviously win this file?Hint: benchmarks/fetch_corpus.sh shows the naming convention; the harness picks up any file in the corpus directory. pandoc must parse and re-serialize; zenfmt’s round-trip is measured in the fixed-point suite.